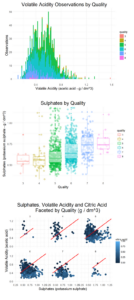
💪 This analysis was built to hone exploratory data analysis skills and required students to perform open-ended exploration on wine data rated by quality.
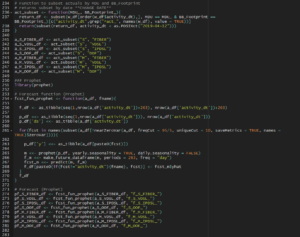
⚙️️ To conduct it required a working knowledge of R and use of the ggplot2 and readr packages.
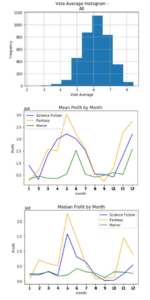
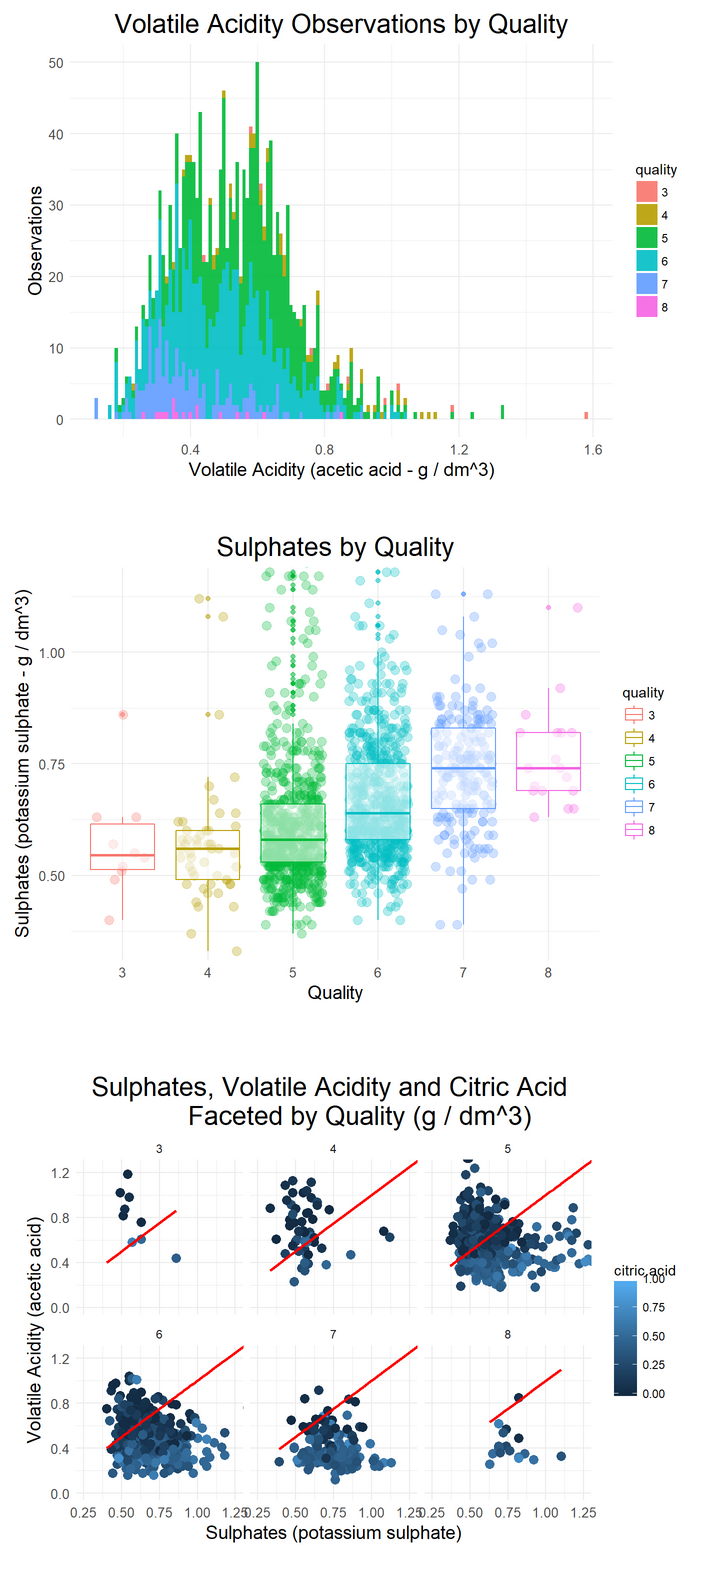
😌 The result was a report visualizing interesting correlations between sulphate content and acidity with wine quality.
My favorite part about this analysis was working with ggplot2 to tweak the visualizations useful in EDA. It’s much easier in spreadsheets to make such changes but in R there are more ways to visualize more data.